
The New Hire Who Built Her Own Dashboard on Day Three
A new HR coordinator needed a headcount and absence overview. Instead of waiting on IT or a BI consultant, she described it in plain English and had it running before lunch.
Picture a small Swiss logistics company, twenty-two employees, based somewhere between Zurich and Winterthur. It is a Wednesday in late October, the quiet week before quarter-end reporting starts in earnest. A new HR coordinator has just started — third day on the job — and her manager asks a simple, entirely reasonable question: "Can you pull together a quick overview of who is out over the next quarter, so we can plan the year-end push?"
In most companies, this is where things slow down. The absence data lives in the HR module. Someone would need to export it, clean it up in Excel, maybe loop in whoever "owns" the BI tool, and wait. For a one-off dashboard that will be used for a week and then forgotten, that is a disproportionate amount of friction — and it is exactly the kind of bottleneck that quietly eats hours across Swiss SMEs every month.
The old way: wait for the data team, or become the data team
Traditional business intelligence tools like Looker or Power BI solve real problems, but they assume someone technical is available to build the report. In a twenty-person company, that someone is often the office manager, the fiduciary, or nobody at all. And spinning up a prototype in a tool like Lovable, Bolt, or Replit Agent means connecting API keys, setting up authentication, and exporting data out of your systems just to get something working — overkill for a dashboard you need this afternoon, not this quarter.
What actually happened instead
The new coordinator opens Flitz and types one sentence into the AI Gallery: "Absence calendar for the next quarter, grouped by team." A few seconds later, a working mini-app appears in the browser — a real calendar view, built with HTML, Alpine.js and Tailwind, already pulling live absence records from the tenant's own data. No CSV export, no spreadsheet, no ticket to IT. The AI Gallery uses the same SQL toolkit as the Flitz AI Assistant, with the same row-level security, so the dashboard only ever shows data she is actually permitted to see.
Her manager glances at it and asks for one tweak: "Can you add a filter by department, and sort by start date?" She types exactly that into the chat. The AI rebuilds the artifact in place — no redesign meeting, no developer handoff. When it looks right, she pins it. It now lives permanently on the team's gallery, visible to everyone who needs it, with her avatar attached as the author.
Then quarter-end hits, and the pattern repeats
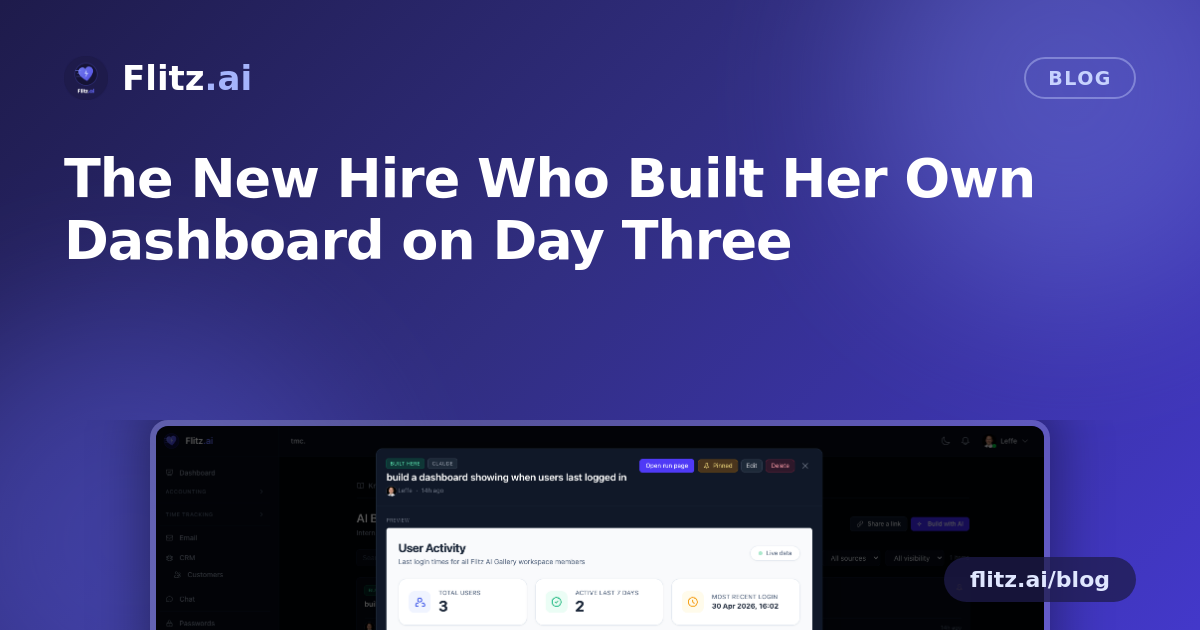
Two weeks later, as quarter-end reporting ramps up, the finance lead needs something different: a dashboard showing which client onboarding tasks are stuck at which stage, so the fiduciary can flag anything at risk before the books close. Rather than filing a request, they describe it directly — "client onboarding checklist with status per stage" — and get a working tool in the same way. Someone else on the team, curious about engagement, asks for a dashboard showing when each employee last logged in. Same process, same five minutes.
None of these three people are developers. None of them needed a BI subscription, a data analyst, or a meeting to get access approved. Each dashboard is scoped to their tenant's real, live data from the first second it exists — this is the core difference from generic AI app builders: the tools you build are connected to your actual business data on day one, not to a sandbox you have to wire up yourself.
Why this matters beyond the one-off dashboard
The more important shift is what happens to all three of these mini-apps afterward. Unlike a one-shot AI Assistant conversation that disappears once the chat ends, gallery items are persistent. The absence calendar, the onboarding tracker, the login dashboard — they do not vanish after quarter-end. They stay pinned, shareable, and re-runnable by anyone with access, quarter after quarter, hire after hire.
That persistence is what turns a convenience into infrastructure. Every internal tool an SME actually needs — an absence overview, an onboarding tracker, an audit-prep checklist, a simple attendance view for a new employee's first week — gets built by whoever is closest to the question, at the moment they need it, instead of queued behind a data team's backlog or built once in Excel and left to rot.
Visibility and control stay with the team
Every item in the gallery carries visibility controls: keep it private while you are still iterating, share it with your team once it is useful, or leave it fully open across the company. Author avatars make it clear who built what, so institutional knowledge about "who knows how this dashboard works" is never lost when someone is on holiday or leaves the role.
The bottleneck that quietly disappears
For a Swiss SME juggling accounting, HR, CRM and a dozen other functions inside one platform, the real cost of the old BI bottleneck was never the tool itself — it was the delay, and the way that delay discouraged people from even asking for a dashboard in the first place. When the team member closest to the question can build the answer themselves, with the data already wired in, that hesitation disappears. The new hire who built an absence calendar on day three did not need permission to be useful. She just needed a sentence.