
From Spreadsheet Chains to Self-Serve Dashboards: Rethinking Internal Tools for Swiss SMEs
Why Swiss SMEs still build internal tools out of spreadsheets and email chains — and how describing a dashboard in plain English, wired to live business data, replaces the old bottleneck.
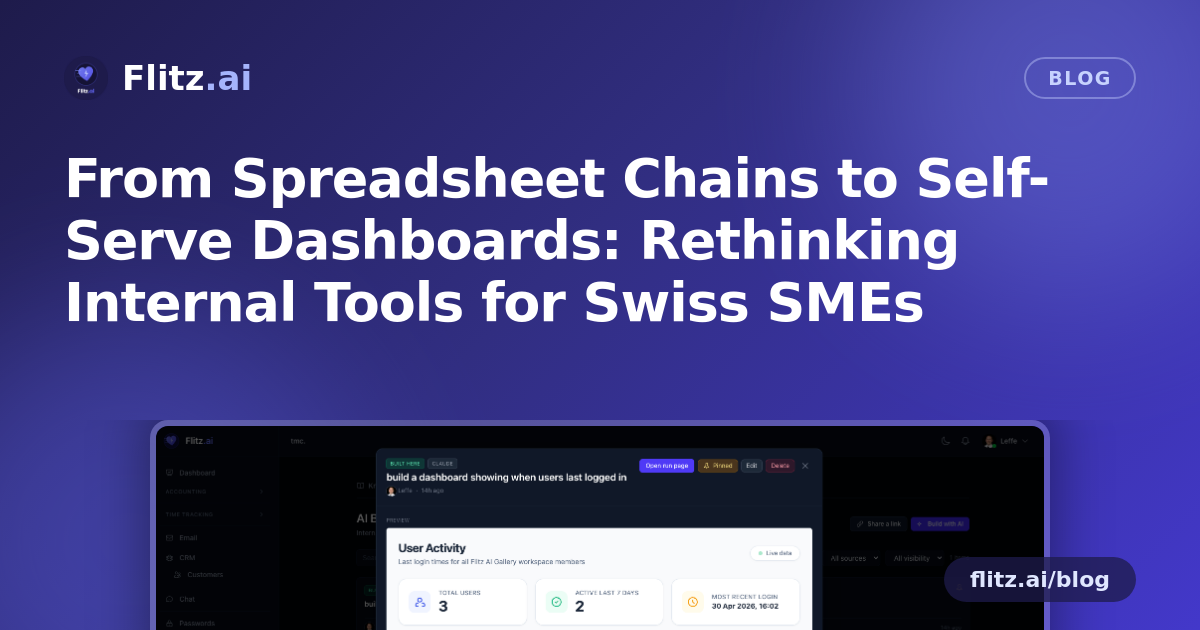
Every Swiss SME eventually hits the same small crisis. Someone needs to know when each team member last logged a timesheet, or which clients are stuck at which onboarding stage, or who's out next quarter. The data technically exists somewhere — in the accounting system, the CRM, the HR module — but nobody has a tool that shows it. So someone builds a spreadsheet.
The old way: spreadsheets, exports, and email chains
This pattern is so common it barely registers as a problem anymore. An office manager exports a CSV from one system, pastes it into Excel, adds some manual formulas, and emails it around. A week later the data is stale. Someone else makes their own version with slightly different numbers. Now there are three "sources of truth" and a Slack thread arguing about which one is correct.
For anything more ambitious — a real-time dashboard, a filterable status board — the usual answer is a BI tool like Power BI or Looker. These are genuinely powerful, but they come with real costs: someone has to model the data, connect it securely, maintain the reports, and usually that someone is a specialist the SME doesn't have on staff. Requests pile up in a queue. By the time the dashboard is ready, the question that prompted it has often changed.
The trade-off is honest: spreadsheets are fast but unreliable and disconnected; BI tools are reliable but slow and gatekept by whoever knows the tooling. Neither is wrong, exactly — they're just built for a world where only a few people can touch the data.
What changes with an AI Gallery
Flitz's AI Gallery starts from a different assumption: the person closest to the question should be able to answer it themselves, without filing a ticket or learning SQL. You describe the tool you want in plain English — "client onboarding checklist with status per stage," "absence calendar for the next quarter," "dashboard showing when each team member last logged in" — and the AI builds a working app right in the browser, using the same SQL toolkit and row-level security as the Flitz AI Assistant. It's reading your real, live tenant data from day one. No API keys, no authentication setup, no exporting anything to a CSV first.
Compare that to building the same thing in a tool like Lovable, Bolt, or Replit Agent: those platforms are excellent at generating app shells, but someone still has to wire up data connections, manage credentials, and figure out access control before the app is useful for a real Swiss business with real client and financial data. Compare it to Power BI or Looker: those tools assume a data specialist is driving. The AI Gallery assumes anyone on the team can drive.
Built to last, not a one-off chat answer
A normal AI Assistant conversation is ephemeral — you get an answer, and if you want it again next month you ask again. Gallery items are different: once you pin one, it becomes a permanent, shareable mini-app that lives on the team's gallery. Anyone with the right visibility can re-run it, and it reflects current data every time, not a snapshot from when it was built.
Each item carries an author avatar and its own visibility setting, so you decide whether something stays private, gets shared with your team, or is pinned to a shared dashboard. And because iteration happens by chatting — "make the avatars bigger," "add a filter by role," "sort by last active" — refining a tool doesn't require reopening a ticket with IT. The AI simply rebuilds the artifact.
Weighing the trade-offs honestly
This approach isn't a replacement for serious enterprise BI if your SME eventually needs deep statistical modelling, forecasting, or governance across hundreds of data sources. For that scale, a dedicated BI practice still earns its keep. But most Swiss SMEs aren't running into that problem. Their problem is smaller and more common: a handful of recurring internal questions that currently get answered with a stale spreadsheet or a round of emails, because setting up a proper tool felt disproportionate to the task.
For that gap — which is most of day-to-day operations — the calculus favours consolidation. One place for the data, one set of permissions already enforced by the same row-level security used elsewhere in Flitz, and one interface for describing what you need instead of configuring it field by field.
Why it matters for Swiss SMEs specifically
Smaller teams in Switzerland rarely have a dedicated data or BI function. Hiring one, or paying for a separate Lovable, Bolt, or Replit subscription on top of a BI license, adds cost and complexity that's hard to justify for a 10- or 30-person company. The AI Gallery removes that bottleneck entirely: the office manager who needs the absence calendar can build it herself, the team lead who wants an onboarding tracker doesn't need to ask anyone, and none of your client or financial data ever leaves your tenant to do it.
The result isn't a flashier spreadsheet. It's the end of needing one in the first place.