
Website Down? Here's How Swiss SMEs Can Stop Finding Out From Angry Customers
Spreadsheets and disconnected tools can catch downtime — eventually. See how integrated uptime monitoring and branded status pages compare, and why consolidation wins for Swiss SMEs.
For most Swiss SMEs, "monitoring" quietly evolves through three stages. Stage one: nobody checks anything, and you find out your site is down when a customer emails asking why checkout is broken. Stage two: someone bookmarks the site and refreshes it manually every so often. Stage three: you sign up for a free tier of a monitoring tool, then another for status pages, then a Slack webhook someone configured two years ago that nobody remembers how to edit.
None of these stages are wrong, exactly. They just don't scale — and for a business running invoicing, a customer portal, or scheduled data jobs, downtime you learn about late is downtime that costs trust, not just revenue.
The old way: spreadsheets, email chains, and point tools
Let's be fair to the old way first, because it does work at very small scale.
- Manual checks cost nothing and require no setup. But they only catch outages when someone happens to be looking — usually after a customer already noticed.
- Free-tier monitoring tools (UptimeRobot, Pingdom, Better Uptime) are genuinely useful for a single website ping. But most SMEs need more than one endpoint watched, and pricing tiers climb fast once you add team alerts, more frequent checks, or a status page.
- Separate status page tools (like Atlassian Statuspage) solve customer communication but live entirely apart from your actual monitors — someone has to manually flip a status page to "degraded" when something breaks.
- Cron job reliability is almost never monitored at all. Nightly backups, invoice exports, bank reconciliation jobs — these run silently, and silently failing is worse than failing loudly, because nobody notices until a report is missing weeks later.
The result is a stack of two, three, sometimes four subscriptions, each with its own login, its own alert rules, and no shared timeline. When an incident actually happens, your team is toggling between tabs trying to piece together what triggered what — while customers are refreshing a status page that hasn't been updated because nobody remembered to log in and change it.
What actually breaks in practice
Three failure patterns show up again and again in small businesses:
- Silent cron failures. A scheduled job — a nightly export, a backup, a sync to your accounting system — quietly stops running, and nobody notices until someone needs the data.
- Alert fatigue or alert blindness. Either everyone gets pinged for everything (and starts ignoring alerts), or nobody gets pinged at all because the one person who set up the webhook left the company.
- Manual status communication. During an actual incident, updating customers competes with actually fixing the problem — so customers wait, and inbound support tickets pile up asking "is it just me?"
The integrated approach: monitors, heartbeats, and status in one place
The alternative isn't more discipline — it's fewer moving parts. That's the idea behind Uptime Monitoring & Public Status Pages inside Flitz: one system that watches your endpoints, your scheduled jobs, and communicates status to customers automatically.
Monitors that check every 30 seconds, from EU infrastructure
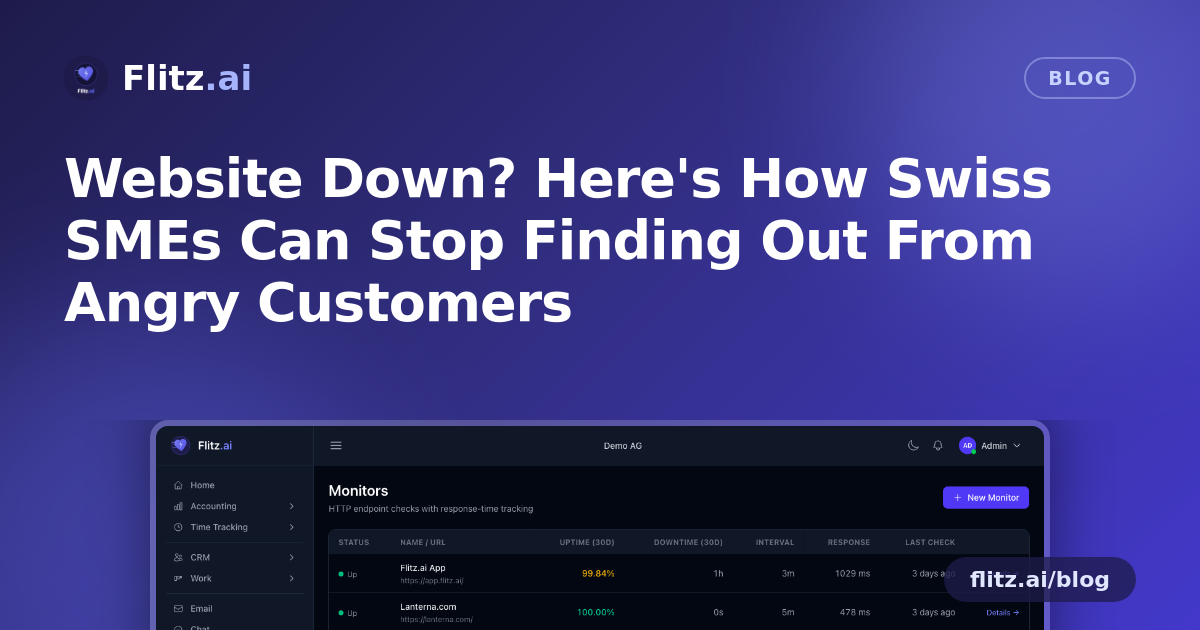
HTTP and HTTPS monitors ping your services every 30 seconds from EU-based infrastructure, tracking response times and per-region check history so you can see not just "up or down" but "how fast, and where it's slow." SSL certificate expiry is tracked automatically too — one less renewal date to remember manually.
Heartbeats for the jobs nobody watches
Cron-job heartbeats flip the usual monitoring model: instead of Flitz checking your service, your service pings a private URL on its own schedule. If that nightly backup or invoice export misses its window, an incident opens automatically — no manual "did the job run?" check required.
One incident timeline, not four browser tabs
When something does go red, an incident opens with a shared timeline: acknowledge and resolve actions, threaded comments for your team, and post-mortem notes for later review. Alerts go out over email and team chat immediately, with support for channels, on-call schedules, and escalation policies — so the right person gets pinged, not everyone, all the time.
A status page customers actually trust
Because the status page pulls from the same monitors and incidents, it updates itself. You publish a branded status page on your own subdomain, choosing exactly which components are visible publicly. Customers can check it themselves instead of emailing support during an outage — which quietly reduces ticket volume during the moments your team is busiest.
Isolation that matters for multi-client fiduciaries
Every monitor, heartbeat, and incident is tenant-scoped. If you're a fiduciary or agency managing infrastructure or reporting jobs for multiple clients, there's never any cross-tenant leakage between accounts.
Weighing the trade-off honestly
Consolidation isn't automatically better in every case. If you only need to watch one website with no team alerting and no status page, a free single-purpose tool is fine, and switching costs time. But the moment you're monitoring more than one thing — a website, a job, a customer portal — and need any of that visible to your team or your customers, the maths flips. Paying for and maintaining three separate logins, none of which talk to each other, costs more in coordination overhead than it saves in subscription fees.
For Swiss SMEs already juggling accounting, invoicing, banking, and HR in separate systems, adding uptime monitoring as one more module inside the same platform — rather than one more standalone bill — is the point. One incident, one timeline, one status page, no missing cron job discovered three weeks too late.